100,000+ data point
45 geo areas & 27 property types
National, Regional and City charts that you can copy to your reports
Take your business to the next level. 10 years experience tracking data
As easy as Point & Click
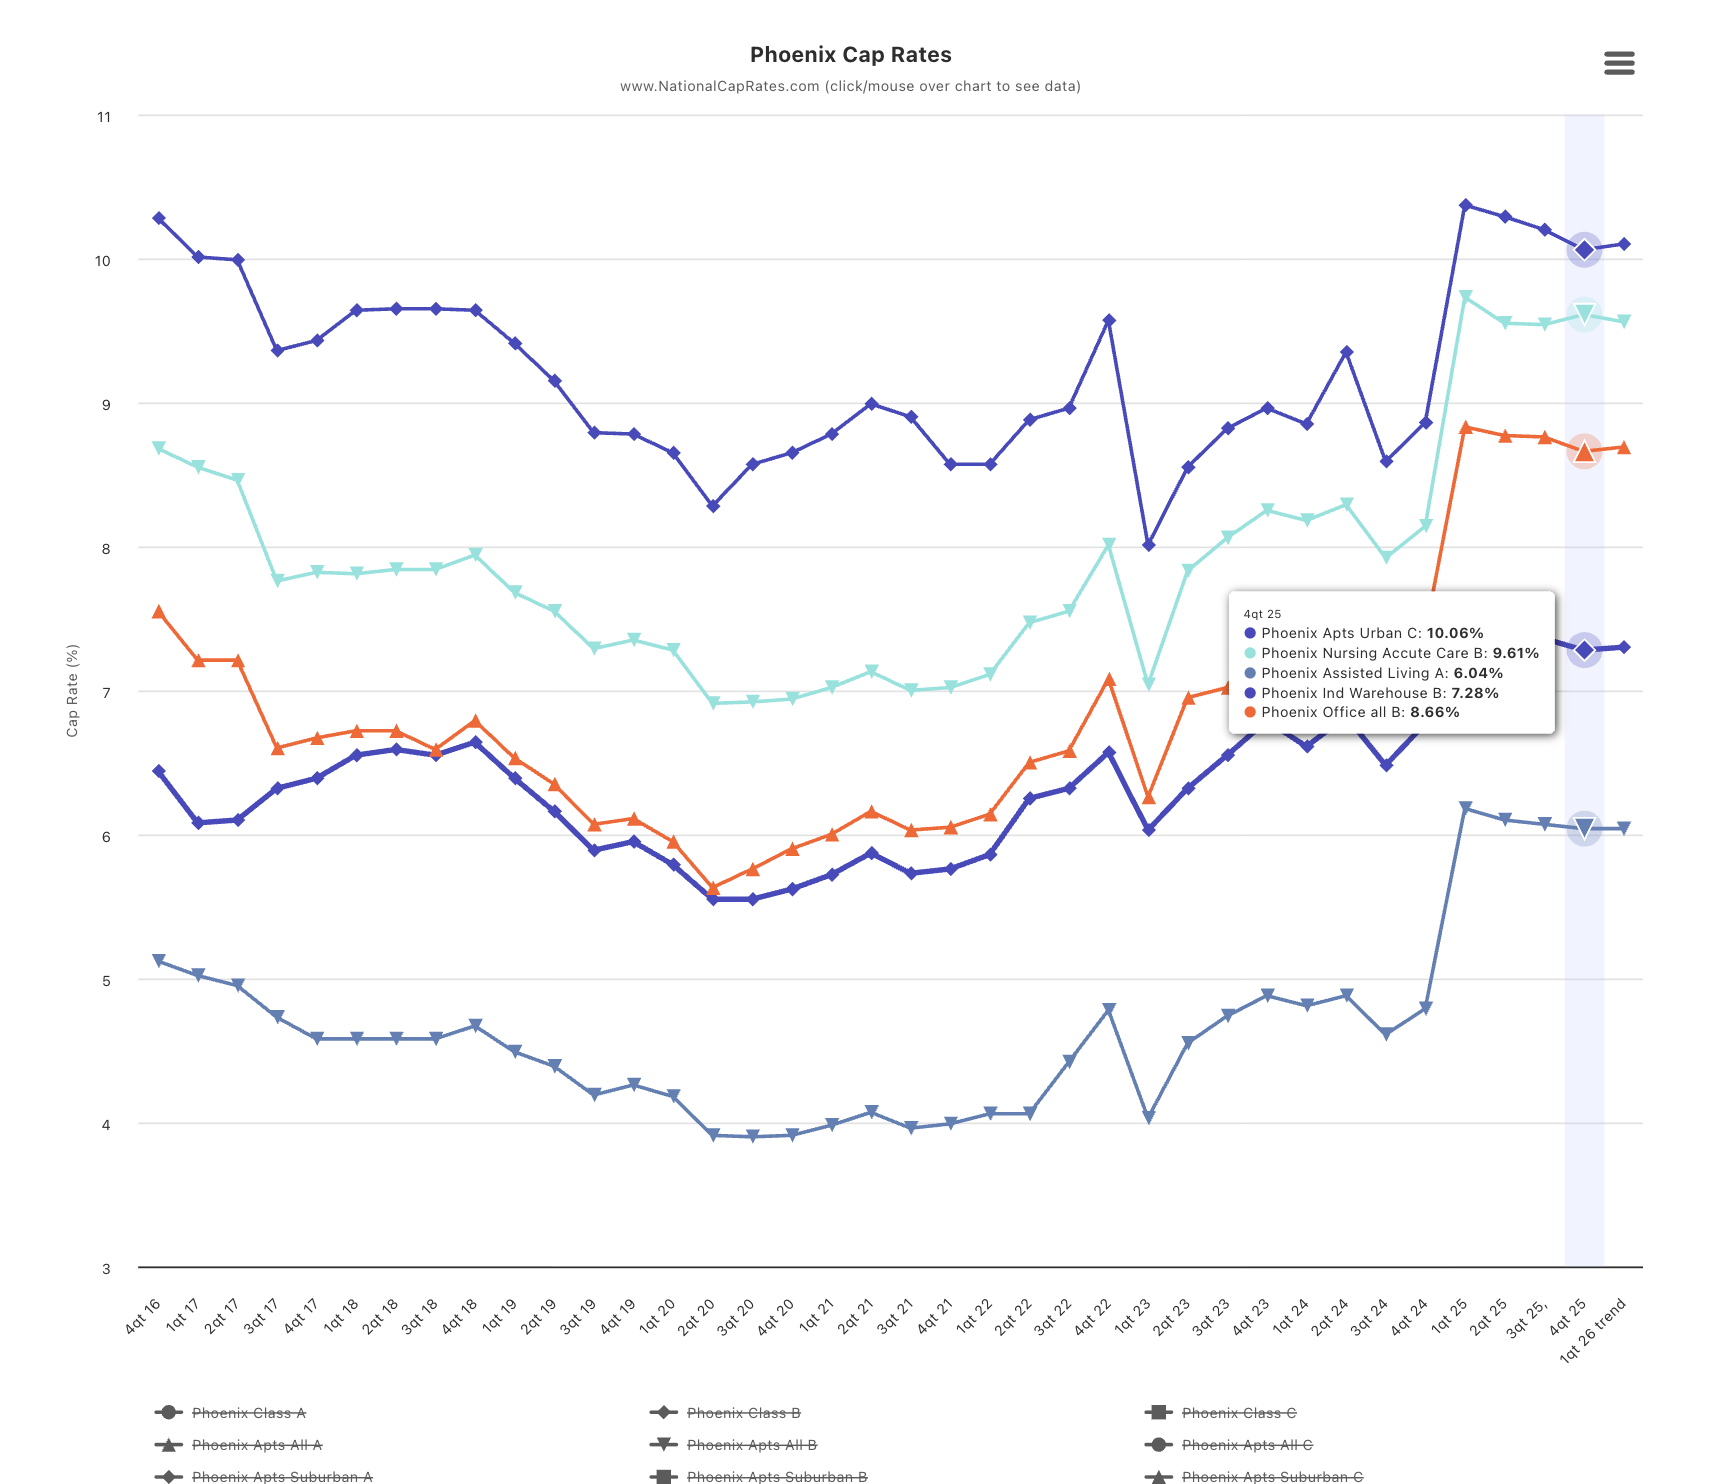
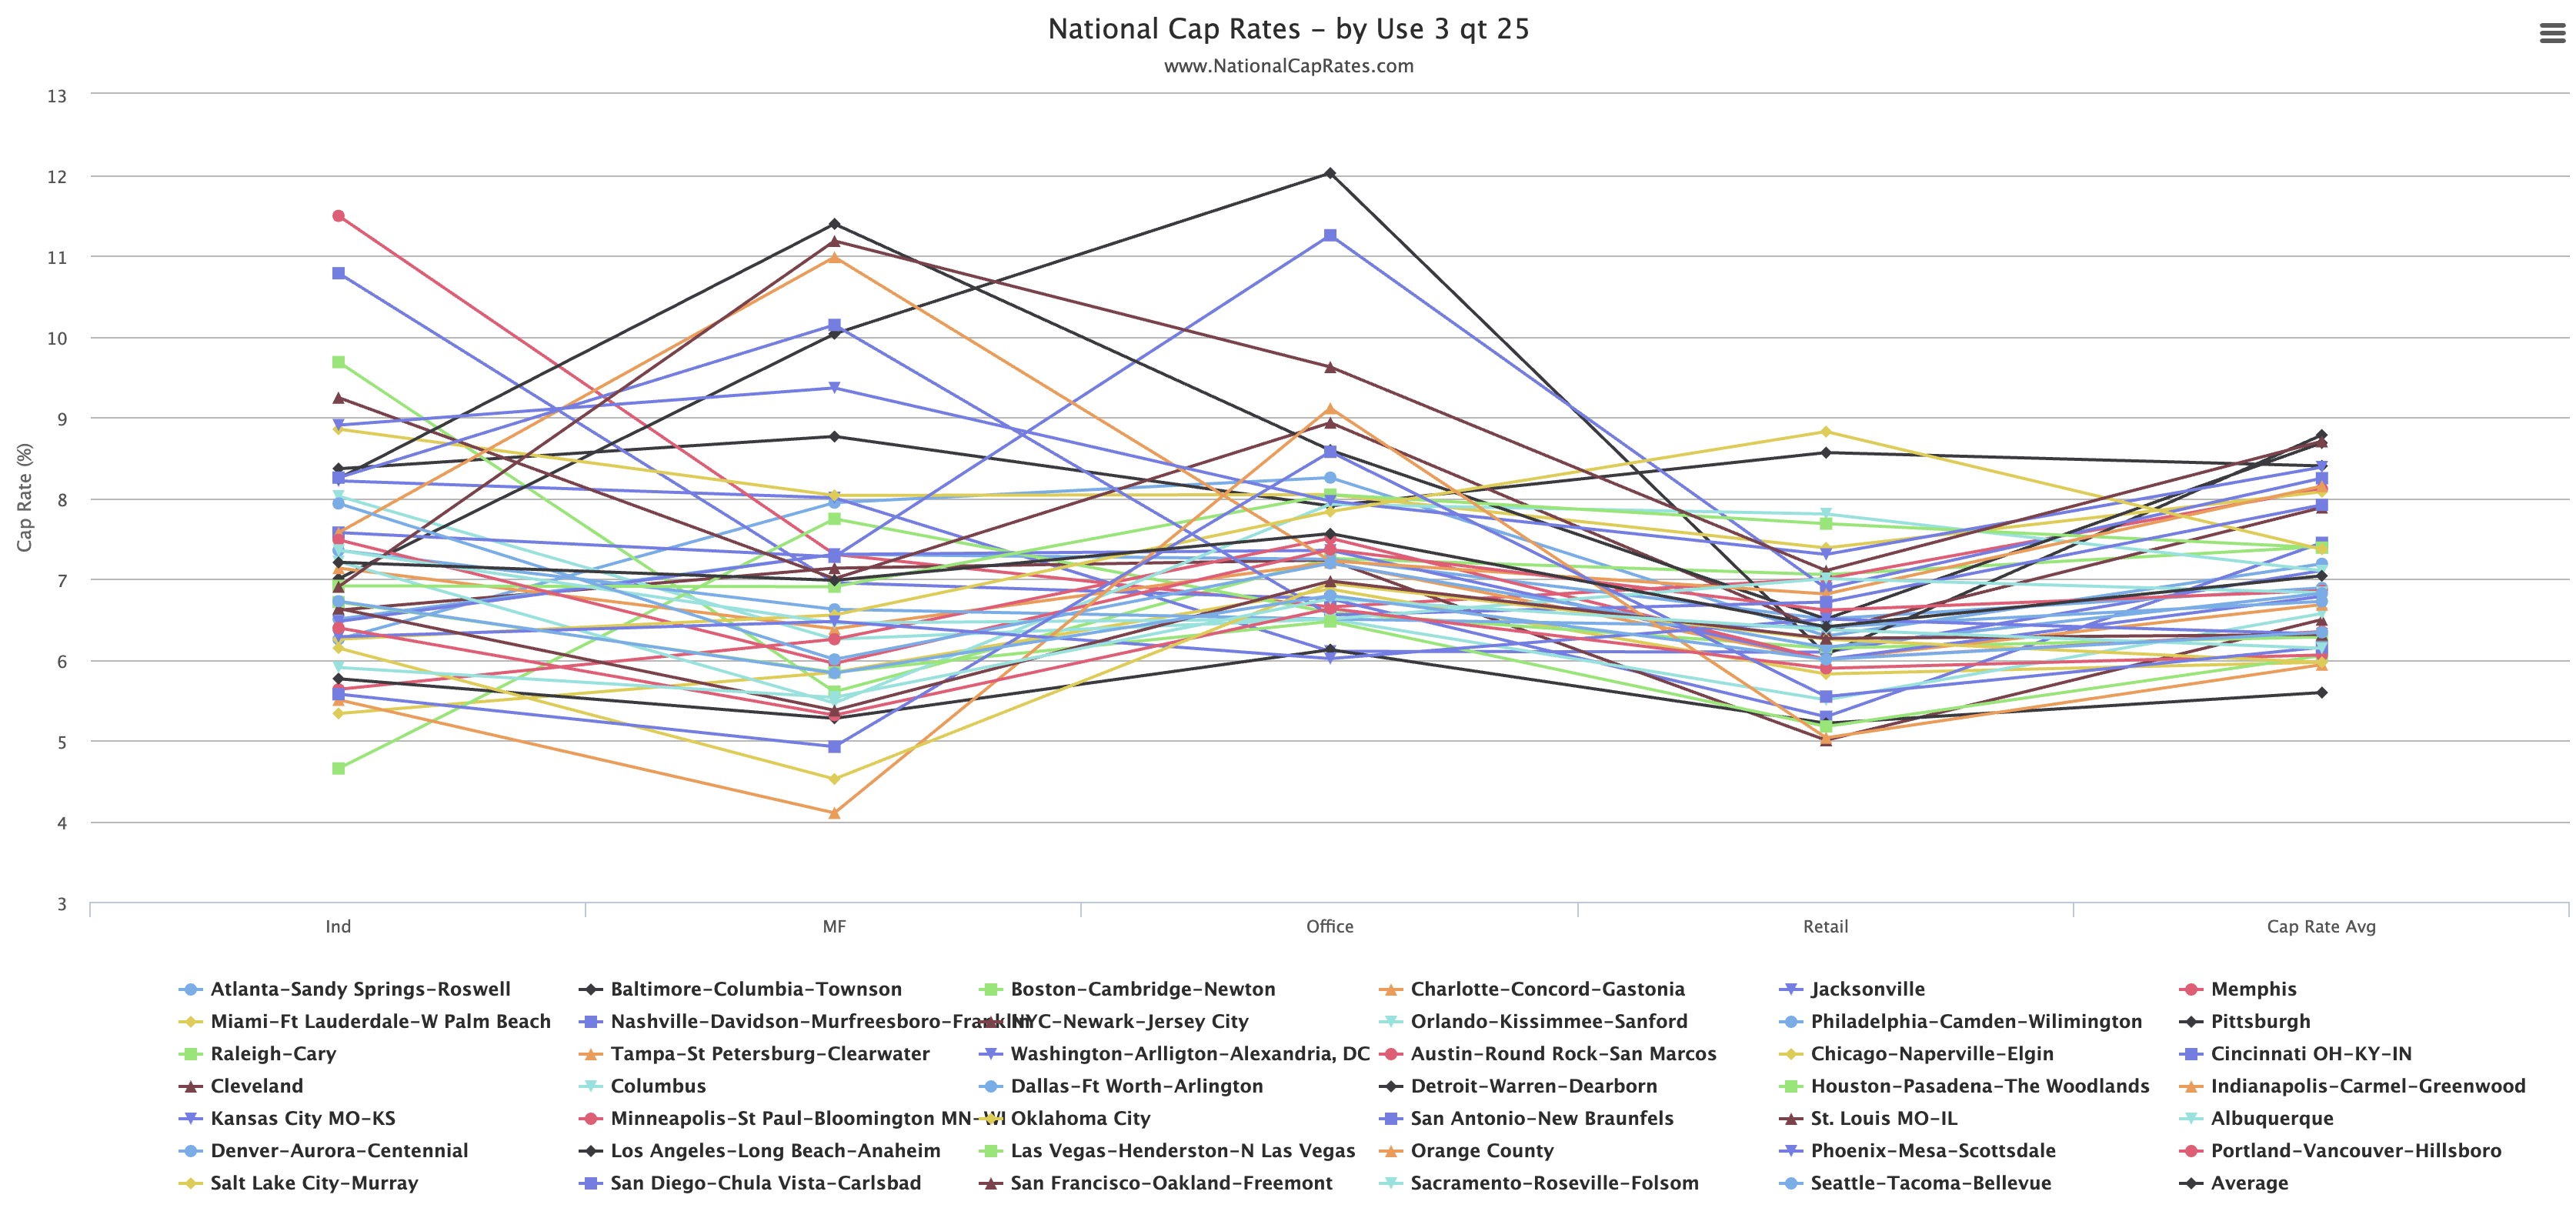
Market Summary
Q4 2025 Cap Rate by City and by Use (Industrial, Office, Multifamily, Retail)
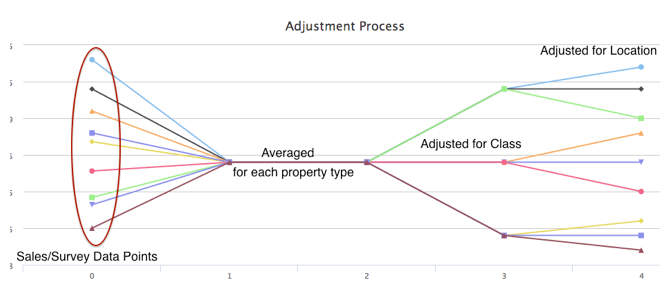
Each month we add thousands of data points. This is a new addition to the Charts and will be upated quarterly. It is currently available on the FREEE STUFF tab in click form.