Background Image

100,000+ data point

45 geo areas & 27 property types

National, Regional and City charts that you can copy to your reports
Take your business to the next level. 10 years experience tracking data
As easy as Point & Click

Free Sample

Market Rankings

Pic
Q3 2024 Average Cap Rate

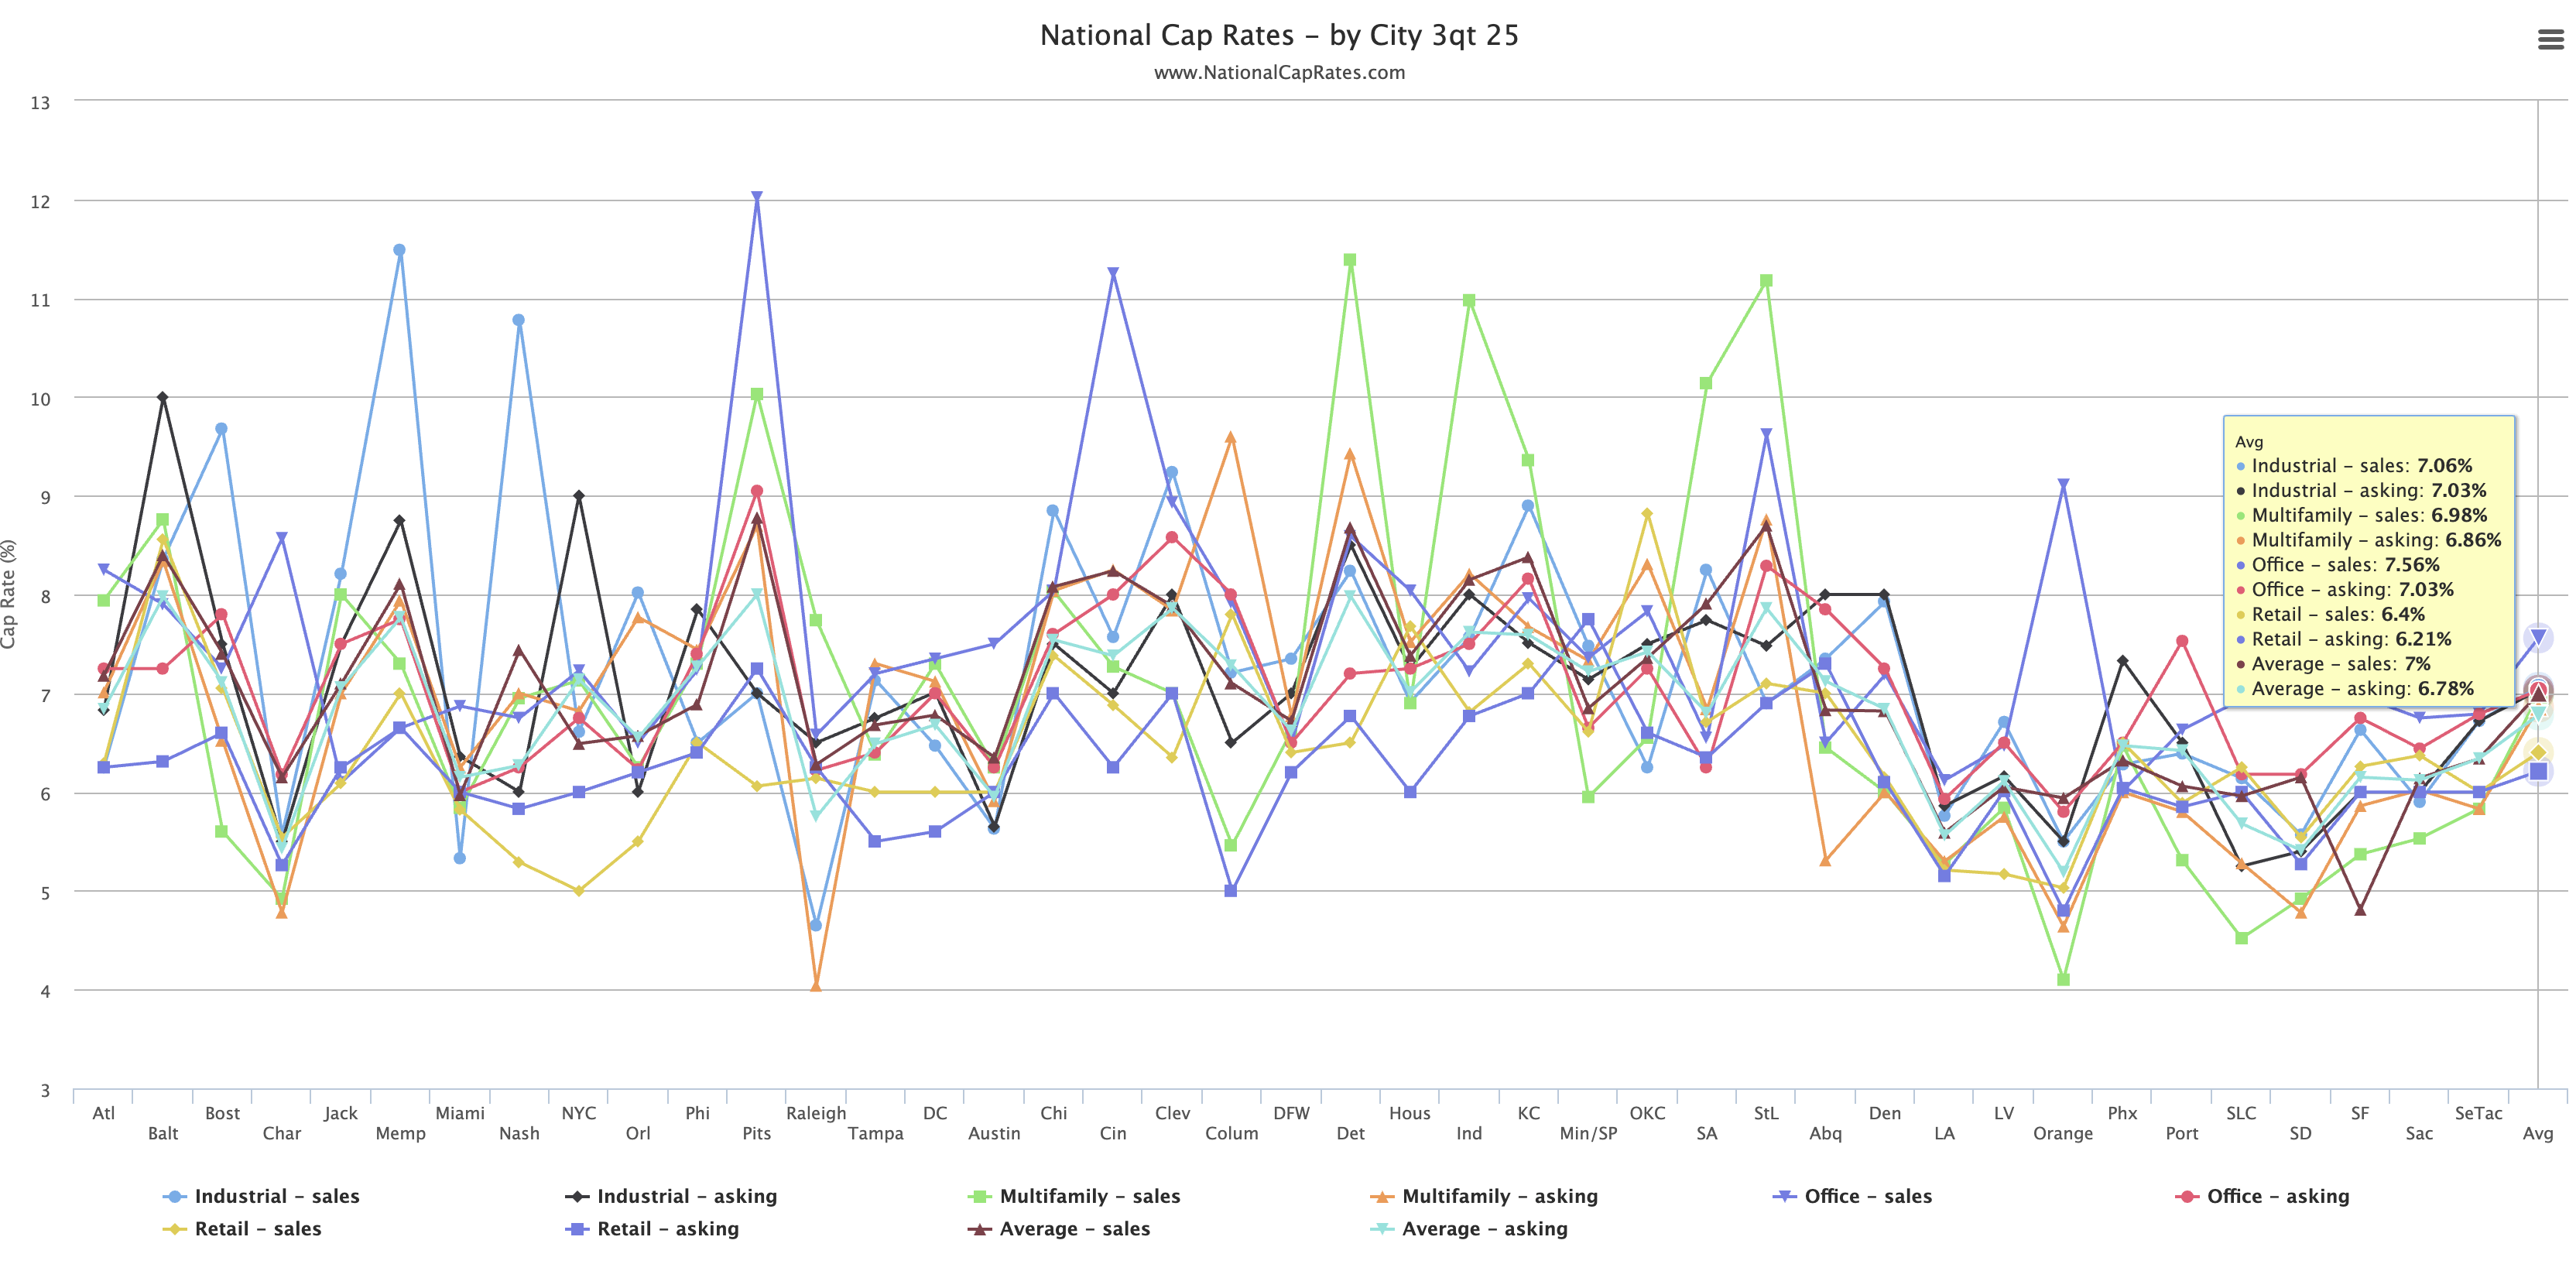
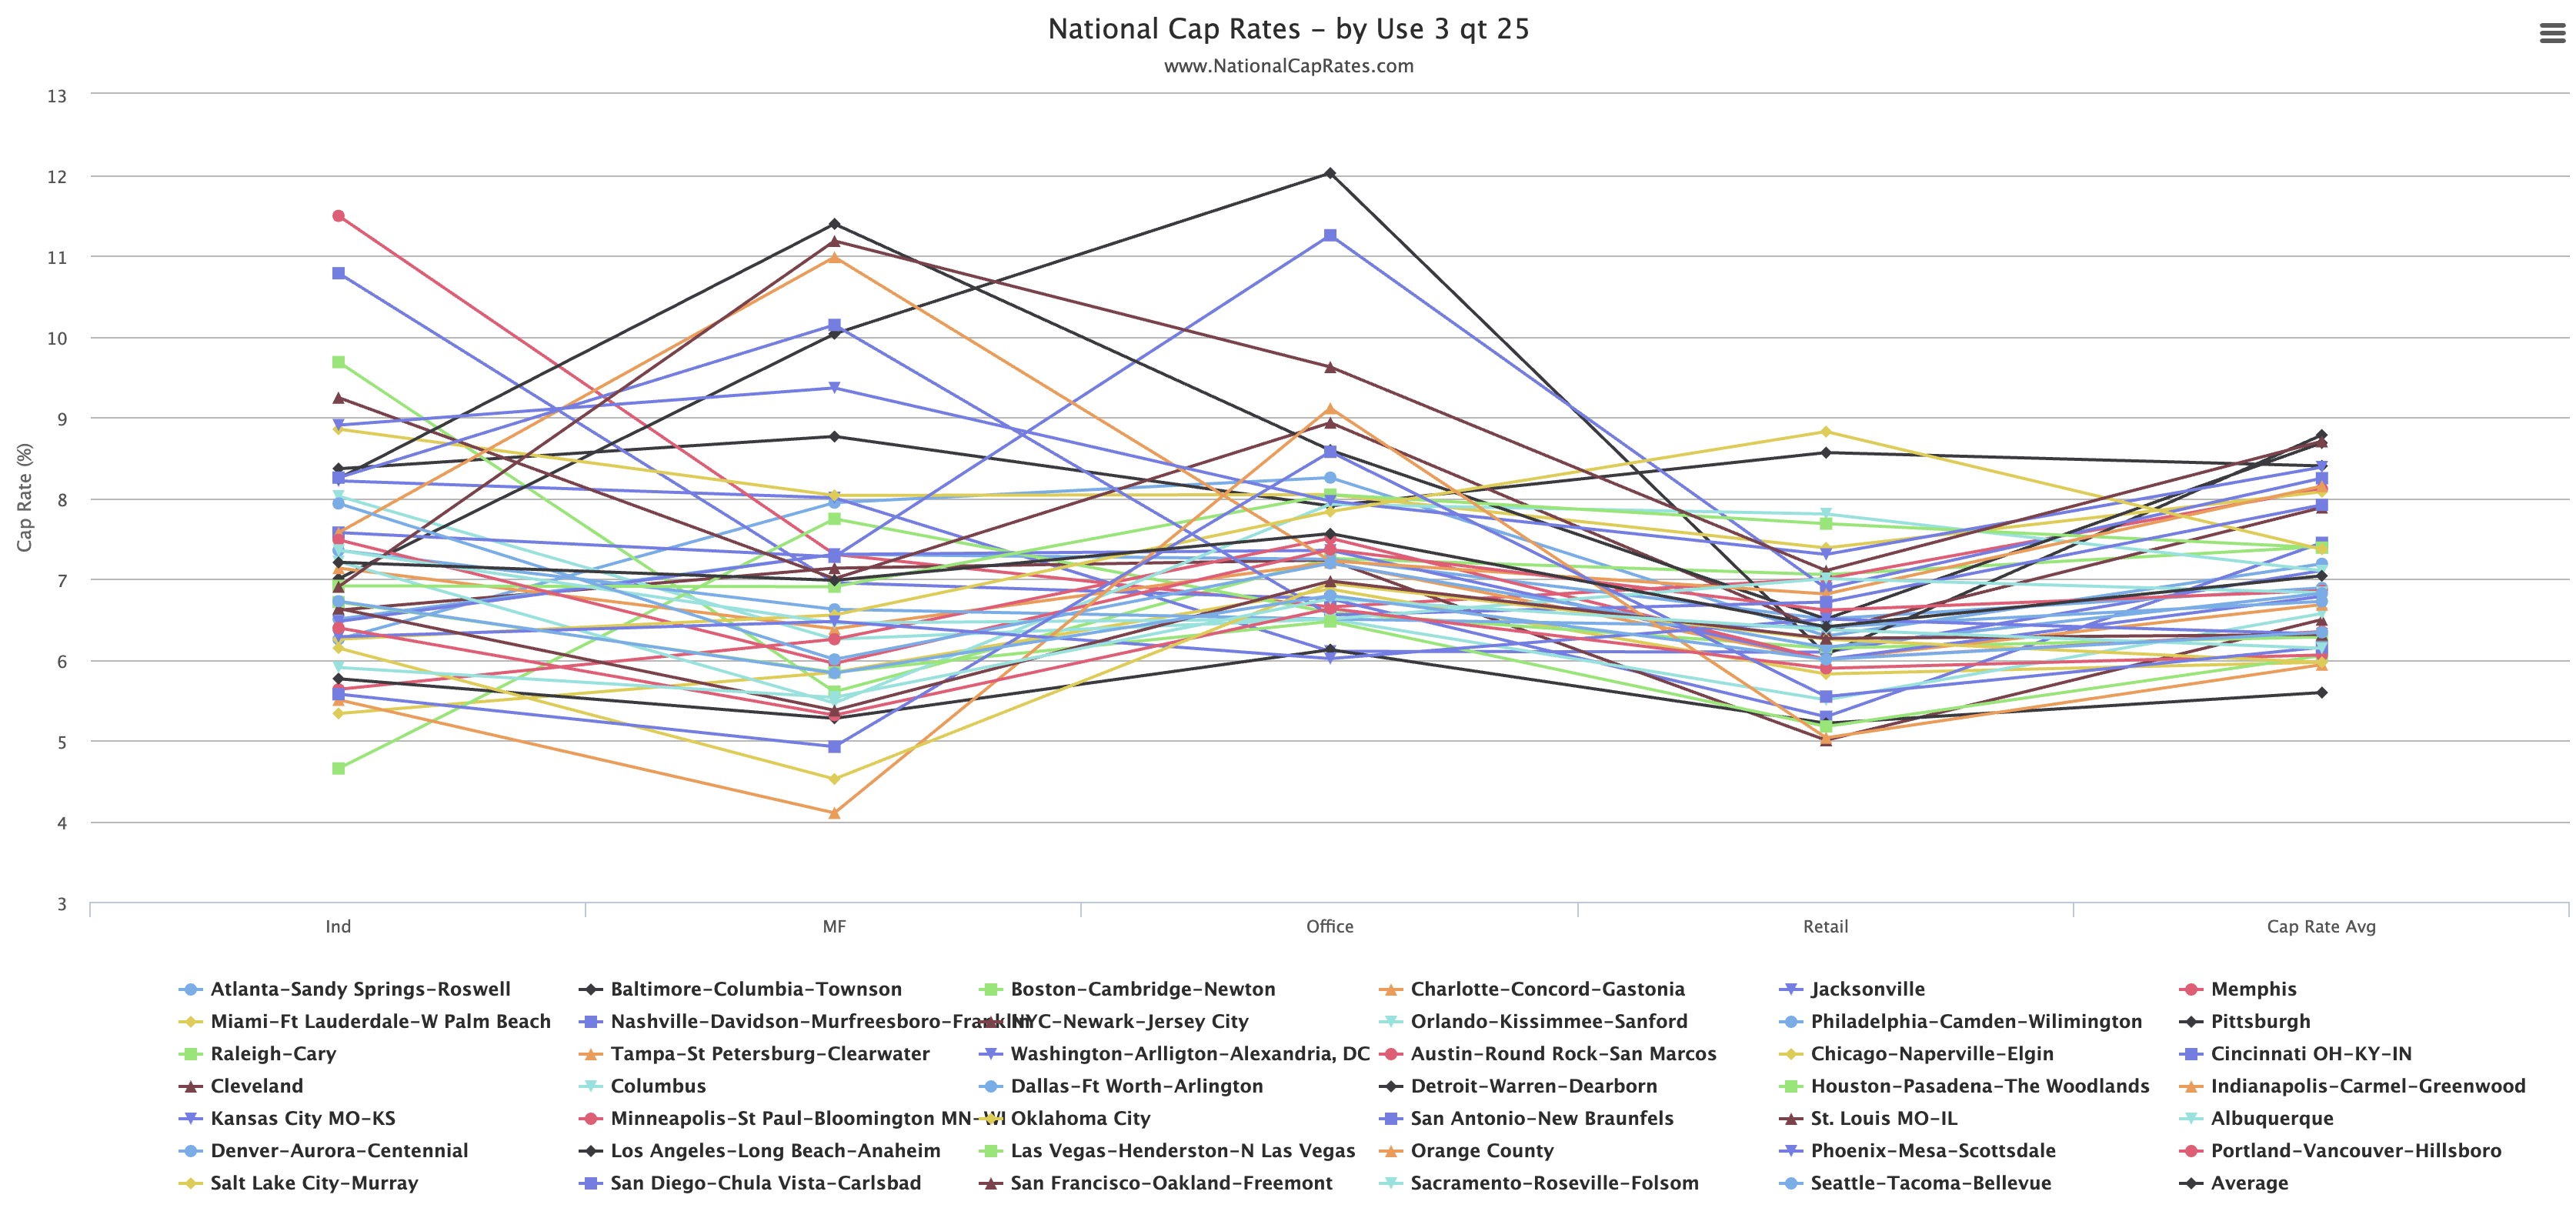
Each month we add thousands of data points. For this past quarter, 2 markets had an average cap rate of below 5.3% while 4 markets were above 8%. Cap rates are in a ping-pong mode with swings affected by raising interest rates, tightening lending requirements and weaker demand. The average was 6.63% for Q2 2024, up slightly from 6.57% for Q1 2024.

Pic
Q3 2024 Commercial Sales/100k population

Rather that look a just the total number of sales that occur in a market, in order to get a comparable picture, we took the total commercial sales and divided it by the population to get a better picture of what markets are hot and which ones are soft.

Market Summary: Cap Rates up slightly during the 2nd quarter 2024

The data indicates an increase of 56 basis point during the 2nd quarter 2024. The trend has been up for 8 of the past 10 quarters. Hopefully this upward trend is beginning to stabilize leading into Q3 2024.

The upward trend started in Q1 2022. For class For Class A properties, between Q1 24 and Q2 24 apartments were +13 bps, Industrial +15 pbs, retail +8 bps and office +12 bps. There were differences between property types with, for example, the cap rate Q2 2024 for Class A suburban apartments at 6.21% compared to 7.81% for senior housing. Warehouse space 6.60% outpaced flex space 7.99%. Suburban offices (7.14%) and medical offices (7.14%) performed better than CBD office space (7.90%).

Nationwide, total commercial sales volume was down -11.3% from the prior quarter and the average days on the market increase by 16%. Interest rate and political uncertainty appear to be major factors fueling investors’ concerns. Sellers with upcoming loan maturities are adding to market uncertainty.

In order to get a clearer picture of the metro areas, we ranked the areas by average cap rate and sales volume per population. Combining the rankings gives us a picture of market strength (lower cap rate) and momentum (highest sales volume). Some markets appear to have high quality sales with strong tenants but otherwise a low volume of activity. The combined rankings gives us a slightly better snapshot of the overall market strength.

Pic

Background Image

Updated 3rd qt 2024

Weighted Trend thru 4th qt 2024

NATIONAL DATA plus

__________________

Eastern US summary plus Atlanta * Baltimore * Boston * Charlotte * Jacksonville * Memphis * Miami * Nashville * NYC * Orlando * Philadelphia * Pittsburgh * Raleigh * Tampa * Washington DC

__________________

Central US summary plus Austin * Chicago * Cincinnati * Cleveland * Columbus * Dallas * Detroit * Houston * Indianapolis * Kansas City * Minneapolis/St Paul * Oklahoma City * San Antonio * Saint Louis

__________________

Western US summary plus Albuquerque * Denver * Las Vegas * Los Angeles * Orange County (LA) * Phoenix * Portland * Salt Lake City * San Diego * San Francisco * Sacramento * Seattle


Pic
Why NationalCapRates.com?

There are a number of good sources for commercial property capitalization rates. As appraisers we believe that local sales are typically the best place to start. As a support source we found ourself wading through reams of pdf reports looking for the best data to fit the property. We wanted something that we could quickly (say in under 60 seconds) log-in track-down and cut-and-paste to our reports. Not finding it, we decided to build our own. While technologically not possible just a few short years ago, today it is. So we went out and assembled a team to gather the data and develop a point-and-click distribution method, all at a reasonable cost.

Pic
Methodology - the Blended Caculated Cap Rate

The data collection process starts with actual sales. This is then combined with surveys of investors, brokers, lenders and appraisers from various qualified sources deemed to be reliable that are formulated into an average for general reference use. Once the baseline numbers are established, we calculate an adjustment for property class and local markets to arrive at a Blended Calculated Capitalization Rate. Most of charts are updated quarterly although some of the data (primarily from the sales analytical side) is update more often. Not every type of sales is available for every market every month. Thus we have created a formula that takes into account baseline sales and survey data and adjusted it to reflect historical differences between property classes and locational differences between various cities.

These numbers are updated to reflect, as best we can, an accurate representation of the where the cap rate is, or as calculated, what is should be. Think of this as sort of a Marshall Valuation Services for Capitalization Rates where baseline numbers are first established and then adjustments are made to the quality/class and location. This information is intended to give you an overall picture of the market. Each property is unique and must be viewed on it’s own individual features. Each community is different with sub-markets that can be vastly different. Judgments about the class of a property need to be made on a property-by-property basis by properly trained individuals. A great source to find a professional in your area is to search the Appraisal Institute directory. This web site does not and cannot attempt to identify the appropriate cap rate for a particular property. That is a task best left to trained and licensed individuals. What we do is provide a tool of what we believe is accurate and reliable information to help in the process. In our experiences, the best source for Capitalization Rates is from local sales of similar properties, individually identified and adjusted to the specifics of a property. This information is intended only to provide an overview of the market and perhaps offer secondary support to your primary findings.


Property Types

Apartments - all

Apartments suburban

Apartments urban

Apartments student

Senior Housing

Nursing - acute care

CCR's

Assisted Living

Industrial - all

Industrial warehouse

Industrial flex

Manufactured Housing Communities

Mobile Home Parks

Office - all

Office CDB

Office suburban

Office medical

Restaurant all

Restaurant limited

Restaurant full service

Retail - all

Retail anchored

Retail unanchored

Retail C-Store

Self Storage - all

Self-Storage climate

Self-Storage non-climate

Average All

What others are saying...

Pic

"Impressed"

I was impressed with the information that National Cap Rates supplied me when other resources failed to track the asset type or market that I was researching. Their methodology and process is very impressive.

Glen Blumenthal, Philadelphia, PA
Pic

"As easy as point and click"

"Point and click and the cap rate information is there is seconds. Comparing property types is seamless and your data supports what my local sale search is telling me. As a commercial appraiser it is important that I have a reliable secondary source for estimating cap rates."

Larry Bloom, MAI, Scottsdale, AZ
Pic

"Interactive"

"I love this. I love how interactive it is and that you can download the chart in different formats."

Sara Oats, Chief Appraiser, Total Appraisal Management Review (TAMR), Austin, TX

What's the Cost?


Pic

National Cap Rates +

All 3 regions, 27 property types and 41 cities.
Nat + All $225

Pic

National Cap Rates +

One region of your choice (includes city data)
Nat + East $175
Nat + Central $175
Nat+ West $175

All licence are for an individual users. Multi-user office discount available. All subscriptions are auto renual - cancel anytime.

ValuATION IMPACT news

Highlights   


*** April 2020  - Uncertainty in the CRE markets leads to uncertainty in the Cap Rates